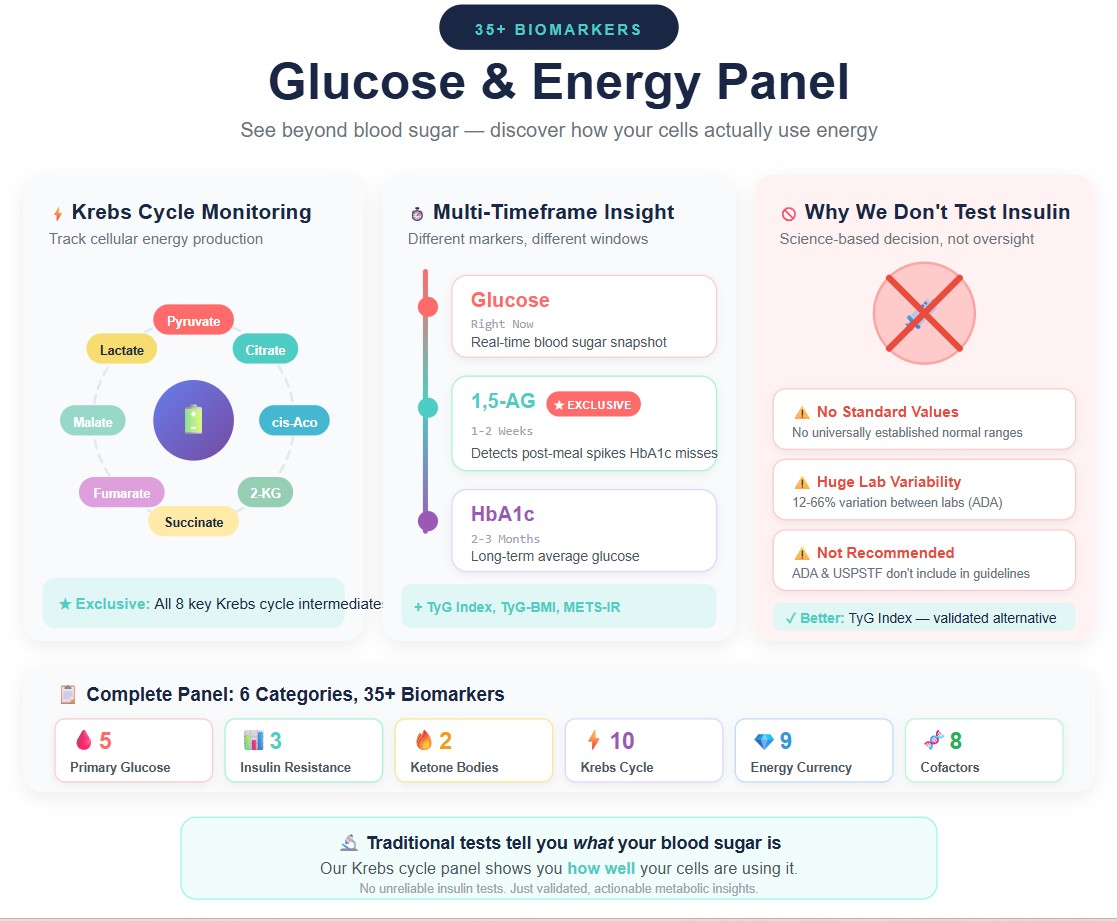
Our comprehensive Glucose and Energy Levels panel includes 35+ biomarkers that provide a complete picture of your glucose metabolism and cellular energy production. Traditional tests tell you what your blood sugar is; our Krebs cycle panel shows you how well your cells are using it. By capturing these metabolic processes, HealthieOne can detect early metabolic dysfunction that standard glucose and A1C tests simply cannot see.
What biomarkers are included in the Glucose and Energy Levels panel?
Primary Glucose Markers
- Glucose: Real-time blood sugar level
- Hemoglobin A1c (HbA1c): Average glucose over 2-3 months
- 1,5-Anhydroglucitol: Short-term glucose control (1-2 weeks) [1,2] ★ Exclusive to HealthieOne
- Galactose: Alternative sugar metabolism ★ Exclusive
- Glucose-6-phosphate: First step of glucose processing ★ Exclusive
Insulin Resistance Screening
- Insulin Resistance Screening (TyG Index): Triglyceride-glucose index [3,4]
- TyG-BMI Index: Combined metabolic risk score [5]
- Metabolic Score for Insulin Resistance (METS-IR) [6]
Note: Universal clinical reference ranges have not been established for these calculated markers. Available cutoffs vary by population and clinical context. These values should be interpreted alongside individual component values, clinical history, and other relevant biomarkers.
Ketone Bodies (Fat Burning Indicators) ★ Exclusive
- Beta-Hydroxybutyrate: Primary ketone body
- Acetoacetic acid: Secondary ketone body
Krebs Cycle / Cellular Energy Production ★ Exclusive
- Citric acid, cis-Aconitic acid, succinic acid, fumaric acid, malic acid, 2-Ketoglutaric acid, pyruvic acid, 2-Hydroxyglutarate: Krebs cycle intermediate or key energy metabolism hub
- Lactic acid: Anaerobic metabolism marker
Energy Currency (Nucleotides) and Amino Acids ★ Exclusive
- Adenine, Adenosine monophosphate (AMP), Adenosine diphosphate (ADP), Cyclic adenosine monophosphate (cAMP), Guanosine, Guanosine monophosphate (GMP), Guanosine diphosphate (GDP), Uridine, Uridine diphosphate (UDP)
- Alanine, Aspartic acid: Krebs cycle connection
- Dimethylglycine: Methylation metabolism
Energy Metabolism Cofactors ★ Exclusive
- Carnitine: Fatty acid transport into mitochondria
- 5-Methyltetrahydrofolate: Active folate form
- Pyridoxal-5’-phosphate: Active vitamin B6
- Vitamin B2 (Riboflavin): FAD/FMN precursor
- Vitamin B5 (Pantothenic acid): CoA precursor
- Vitamin B6 (Pyridoxine): Amino acid metabolism
- Nicotinamide: NAD+ precursor
- Nicotinic acid (Niacin/B3): NAD+/NADP+ precursor
What makes 1,5-Anhydroglucitol (1,5-AG) special?
HealthieOne is one of the only direct-to-consumer testing services to include 1,5-AG in our panel. Despite being FDA-cleared since 2003, 1,5-AG tests are rarely ordered and are typically only available through hospitals and specialized clinical reference laboratories.[7]
This biomarker is particularly valuable because it more accurately predicts rapid changes in glycemia than HbA1c or fructosamine and is more tightly associated with glucose fluctuations and post-meal (postprandial) glucose levels.[8] This means we can detect glucose control issues that standard tests simply miss.
1,5-AG is a naturally occurring sugar found in nearly all foods. Under normal conditions, your kidneys reabsorb 1,5-AG and maintain stable blood levels. However, when blood glucose exceeds the renal threshold (approximately 180 mg/dL), glucose competes with 1,5-AG for reabsorption, causing 1,5-AG to be excreted in urine and its blood levels to drop.[1]
This makes 1,5-AG particularly useful for detecting postprandial (after-meal) glucose spikes and recent glycemic variability that may not be apparent from HbA1c alone.[2,8]
At HealthieOne, our proprietary LC-MS/MS metabolomics technology allows us to measure biomarkers like 1,5-AG and the complete Krebs cycle intermediates that are typically only available through hospital laboratories and specialized reference labs.
Why doesn’t HealthieOne include insulin in the panel?
Insulin levels are highly variable throughout the day and are significantly affected by your fasting state, recent meals, stress, and even the time of blood draw. Unlike glucose and HbA1c, there are no universally established normal values for insulin levels.[9]
Major health organizations, including the American Diabetes Association (ADA) and the United States Preventive Services Task Force (USPSTF), do not currently include insulin level measurements or direct recommendations for measuring fasting insulin levels in their diagnostic guidelines.[9,10]
There are several well-documented limitations with insulin testing:
Lack of standardization: The American Diabetes Association convened a task force that found insulin assays from different laboratories produce widely variable results. Among-assay variation (CV) ranged from 12% to 66%, with a median of 24%.[11]
Results not comparable: The lack of standardization of insulin assay procedures prevents the comparison of results between studies; consequently, studies can be compared only qualitatively.[12]
Significant inter-assay variability: A 2025 study evaluating 12 commercial insulin assays found that differences relative to the reference method (LC-MS) ranged from −298.2 to +302.6 pmol/L. Despite all methods claiming traceability to the WHO standard, significant variability persists.[13]
Not recommended by ADA: ADA Standards of Care (2025) do not recommend measuring fasting insulin, HOMA indices, or oral glucose tolerance test insulin patterns to select initial pharmacotherapy in those with type 2 diabetes.[14]
References
1. Frontiers in Endocrinology. The clinical potential of 1,5-anhydroglucitol as biomarker in diabetes mellitus. 2024. “1,5-AG reflects blood glucose changes in 1 to 2 weeks; decreased levels serve as a clinical indicator of short-term blood glucose disturbances.” https://www.frontiersin.org/journals/endocrinology/articles/10.3389/fendo.2024.1471577/full
2. PMC - International Journal of Molecular Sciences. 1,5-Anhydroglucitol as a Marker of Acute Hyperglycemia in Cardiovascular Events. 2022. “1,5-AG reflects glucose excursions over 1-3 days to 2 weeks.” https://pmc.ncbi.nlm.nih.gov/articles/PMC10044046/
3. Guerrero-Romero F, Simental-Mendía LE, González-Ortiz M, et al. The product of triglycerides and glucose, a simple measure of insulin sensitivity. Comparison with the euglycemic-hyperinsulinemic clamp. J Clin Endocrinol Metab. 2010;95(7):3347-3351. “This study demonstrated high sensitivity (96.5%) and specificity (85.0%) compared with HOMA-IR and the gold standard euglycemic-hyperinsulinemic clamp test.” https://pubmed.ncbi.nlm.nih.gov/20484475/
4. Sánchez-García A, et al. Diagnostic Accuracy of the Triglyceride and Glucose Index for Insulin Resistance: A Systematic Review. Int J Endocrinol. 2020;2020:4678526. “The highest achieved sensitivity was 96% using HIEC, and the highest specificity was 99% using HOMA-IR.” https://pubmed.ncbi.nlm.nih.gov/32256572/
5. Er LK, Wu S, Chou HH, et al. Triglyceride Glucose-Body Mass Index Is a Simple and Clinically Useful Surrogate Marker for Insulin Resistance in Nondiabetic Individuals. PLoS One. 2016;11(3):e0149731. “TyG-BMI is a clinically useful surrogate in identification of IR, as it combines TG, FPG, and adiposity... ROC curve analysis suggested that TyG-BMI had the largest AUC (0.801), demonstrating superior performance in recognizing IR.” https://journals.plos.org/plosone/article?id=10.1371/journal.pone.0149731
6. Bello-Chavolla OY, Almeda-Valdes P, Gomez-Velasco D, et al. METS-IR, a novel score to evaluate insulin sensitivity, is predictive of visceral adiposity and incident type 2 diabetes. Eur J Endocrinol. 2018;178(5):533-544. “METS-IR demonstrated better correlation with the M-value (ρ = -0.622) and diagnostic performance to detect impaired insulin sensitivity compared to EHC (AUC: 0.84). METS-IR was validated against the euglycemic-hyperinsulinemic clamp.” https://pubmed.ncbi.nlm.nih.gov/29535168/
7. Wikipedia. 1,5-Anhydroglucitol. “Despite this possible use and its approval by the FDA, 1,5-AG tests are rarely ordered.” https://en.wikipedia.org/wiki/1,5-anhydroglucitol
8. Dungan KM. 1,5-anhydroglucitol (GlycoMark) as a marker of short-term glycemic control and glycemic excursions. Expert Rev Mol Diagn. 2008;8(1):9-19. “1,5-AG more accurately predicts rapid changes in glycemia than hemoglobin A1C or fructosamine.” https://pubmed.ncbi.nlm.nih.gov/18088226/
9. Veri/Levels Health. What Are Optimal Fasting Insulin Levels for Metabolic Health? “There are no universally established normal values for insulin levels... ADA and USPSTF do not currently include insulin level measurements in their guidelines.” https://www.veri.co/learn/optimal-fasting-insulin-level
10. American Diabetes Association. Diagnosis and Classification of Diabetes: Standards of Care in Diabetes—2025. Diabetes Care. 2025;48(Suppl 1):S27. [ADA diagnostic criteria use A1C, fasting plasma glucose, and OGTT—not fasting insulin.] https://diabetesjournals.org/care/article/48/Supplement_1/S27/157566/
11. Marcovina S, et al; Insulin Standardization Workgroup. Standardization of insulin immunoassays: report of the ADA Workgroup. Clin Chem. 2007;53(4):711-6. “Among-assay CVs ranged from 12% to 66%, with a median value of 24%.” https://pubmed.ncbi.nlm.nih.gov/17272483/
12. Anastasopoulou C, John TA. Insulin: Background, Serum Insulin Measurement, Interpretation. Medscape/eMedicine. “The lack of standardization prevents the comparison of results between studies.” https://emedicine.medscape.com/article/2089224-overview
13. Rohlfing C, et al. The current status of serum insulin measurements and the need for standardization. Clin Chem Lab Med. 2025;63(12):2442-2446. “Differences relative to LC-MS ranged from −298.2 to +302.6 pmol/L.” https://pmc.ncbi.nlm.nih.gov/articles/PMC12452087/
14. American Diabetes Association Professional Practice Committee. Pharmacologic Approaches to Glycemic Treatment: Standards of Care in Diabetes—2025. Diabetes Care. 2025;48(1 Suppl 1):S181-S206. “ADA Standards of Care (2025) do not recommend measuring fasting insulin, HOMA indices, or OGTT insulin patterns.”
No comments yet. Be the first!